mirror of
https://github.com/netdata/netdata.git
synced 2025-04-29 07:00:01 +00:00
* Doc Ansible installation improved wording

* Ansible Improved Wording

* Kickstart reorganized footerless

* AWS, AZURE, K8S, Improved wording
188 lines
No EOL
7.6 KiB
Markdown
188 lines
No EOL
7.6 KiB
Markdown
import Tabs from '@theme/Tabs';
|
|
import TabItem from '@theme/TabItem';
|
|
|
|
# Install Netdata on Kubernetes
|
|
|
|
This document details how to install Netdata on an existing Kubernetes (k8s) cluster, and connect it to Netdata Cloud.
|
|
|
|
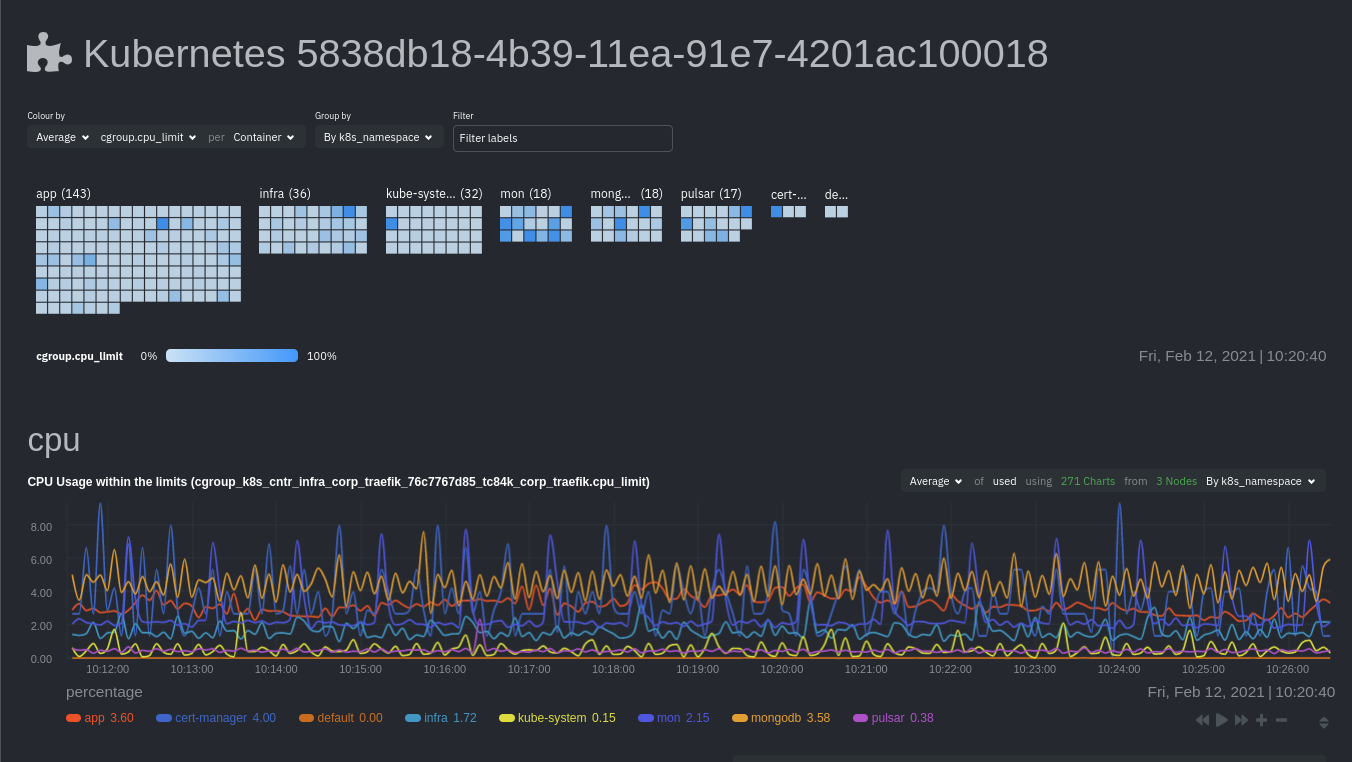
Read our [Kubernetes visualizations](/docs/dashboards-and-charts/kubernetes-tab.md) documentation, to see what you will get.
|
|
|
|
The [Netdata Helm chart](https://github.com/netdata/helmchart/blob/master/charts/netdata/README.md) installs one `parent` pod for storing metrics and managing alert notifications, plus an additional `child` pod for every node in the cluster, responsible for collecting metrics from the node, Kubernetes control planes, pods/containers, and [supported application-specific metrics](https://github.com/netdata/helmchart#service-discovery-and-supported-services).
|
|
|
|
## Prerequisites
|
|
|
|
To deploy Kubernetes monitoring with Netdata, you'll need:
|
|
|
|
- A working cluster running Kubernetes v1.9 or newer.
|
|
- The [kubectl](https://kubernetes.io/docs/reference/kubectl/overview/) command line tool, within [one minor version
|
|
difference](https://kubernetes.io/docs/tasks/tools/install-kubectl/#before-you-begin) of your cluster, on an
|
|
administrative system.
|
|
- The [Helm package manager](https://helm.sh/) v3.0.0 or newer on the same administrative system.
|
|
- A Netdata Cloud account with a Space to connect the cluster to.
|
|
|
|
## Deploy Netdata on your Kubernetes Cluster
|
|
|
|
First, you need to add the Netdata helm repository, and then install Netdata.
|
|
The installation process securely connects your Kubernetes cluster to stream metrics data to Netdata Cloud, enabling Kubernetes-specific visualizations like the health map and time-series composite charts.
|
|
|
|
<Tabs groupId="installation_type">
|
|
<TabItem value="new_installations" label="New Installations">
|
|
|
|
<h3> Install Netdata via the <code>helm install</code> command </h3>
|
|
|
|
#### Steps
|
|
|
|
1. Add the Netdata Helm chart repository by running:
|
|
|
|
```bash
|
|
helm repo add netdata https://netdata.github.io/helmchart/
|
|
```
|
|
|
|
2. To install Netdata using the `helm install` command, run:
|
|
|
|
```bash
|
|
helm install netdata netdata/netdata
|
|
```
|
|
|
|
> **Note**
|
|
>
|
|
> If you plan to connect the node to Netdata Cloud, you can find the command with the right parameters by clicking the "Add Nodes" button in your Space's Nodes tab.
|
|
|
|
For more installation options, please read our [Netdata Helm chart for Kubernetes](https://github.com/netdata/helmchart/blob/master/charts/netdata/README.md) reference.
|
|
|
|
#### Expected Result
|
|
|
|
Run `kubectl get services` and `kubectl get pods` to confirm that your cluster now runs a `netdata` service, one parent pod, and multiple child pods.
|
|
|
|
</TabItem>
|
|
<TabItem value="existing_installations" label="Existing Installations">
|
|
|
|
<h3> Connect an existing Netdata installation to Netdata Cloud </h3>
|
|
|
|
On an existing installation, in order to connect it to Netdata Cloud you will need to override the configuration values by running the `helm upgrade` command and provide a file with the values to override.
|
|
|
|
#### Steps
|
|
|
|
1. You can start with creating a file called `override.yml`
|
|
|
|
```bash
|
|
touch override.yml
|
|
```
|
|
|
|
2. Paste the following into your `override.yml` file.
|
|
|
|
```yaml
|
|
parent:
|
|
claiming:
|
|
enabled: true
|
|
token: YOUR_CLAIM_TOKEN
|
|
rooms: YOUR_ROOM_ID_A,YOUR_ROOM_ID_B
|
|
|
|
child:
|
|
claiming:
|
|
enabled: true
|
|
token: YOUR_CLAIM_TOKEN
|
|
rooms: YOUR_ROOM_ID_A,YOUR_ROOM_ID_B
|
|
configs:
|
|
netdata:
|
|
data: |
|
|
[db]
|
|
db = ram
|
|
retention = 3600
|
|
[health]
|
|
enabled = no
|
|
```
|
|
|
|
> **Note**
|
|
>
|
|
> Make sure to replace `YOUR_CLAIM_TOKEN` with the claim token of your space,
|
|
> and `YOUR_ROOM_ID` with the ID of the Room you are willing to connect to.
|
|
|
|
These settings connect your `parent`/`child` nodes to Netdata Cloud and store more metrics in the nodes' time-series databases.
|
|
|
|
> **Info**
|
|
>
|
|
> These override settings, along with the Helm chart's defaults, will retain an hour's worth of metrics (`retention = 3600`, or `3600 seconds`) on each child node. Based on your metrics retention needs, and the resources available on your cluster, you may want to increase the `history` setting.
|
|
|
|
3. To apply these new settings, run:
|
|
|
|
```bash
|
|
helm upgrade -f override.yml netdata netdata/netdata
|
|
```
|
|
|
|
#### Expected Result
|
|
|
|
The cluster terminates the old pods and creates new ones with the proper persistence and connection configuration. You'll see your nodes, containers, and pods appear in Netdata Cloud in a few seconds.
|
|
|
|
</TabItem>
|
|
</Tabs>
|
|
|
|
|
|
|
|
If you don't need to configure your Netdata deployment, [skip down](#whats-next) to see how Kubernetes monitoring works in Netdata, in addition to more guides and resources.
|
|
|
|
## Configure your Netdata monitoring deployment
|
|
|
|
Read up on the various configuration options in the [Helm chart
|
|
documentation](https://github.com/netdata/helmchart#configuration) if you need to tweak your Kubernetes monitoring.
|
|
|
|
Your first option is to create an `override.yml` file, if you haven't created one already upon [deploying](#deploy-netdata-on-your-kubernetes-cluster), then apply the new configuration to your cluster with `helm
|
|
upgrade`.
|
|
|
|
```bash
|
|
helm upgrade -f override.yml netdata netdata/netdata
|
|
```
|
|
|
|
If you want to change only a single setting, use the `--set` argument with `helm upgrade`. For example, to change the
|
|
size of the persistent metrics volume on the parent node:
|
|
|
|
```bash
|
|
helm upgrade --set parent.database.volumesize=4Gi netdata netdata/netdata
|
|
```
|
|
|
|
### Configure service discovery
|
|
|
|
Netdata's [service discovery](https://github.com/netdata/agent-service-discovery/#service-discovery), installed as part
|
|
of the Helm chart installation, finds what services are running in a cluster's containers and automatically collects
|
|
service-level metrics from them.
|
|
|
|
Service discovery supports [popular applications](https://github.com/netdata/helmchart#applications) and [Prometheus endpoints](https://github.com/netdata/helmchart#prometheus-endpoints).
|
|
|
|
If your cluster runs services on non-default ports or uses non-default names, you may need to configure service
|
|
discovery to start collecting metrics from your services. You have to edit the default ConfigMap that is shipped with
|
|
the Helmchart and deploy that to your cluster.
|
|
|
|
First, copy the default file to your administrative system.
|
|
|
|
```bash
|
|
curl https://raw.githubusercontent.com/netdata/helmchart/master/charts/netdata/sdconfig/child.yml -o child.yml
|
|
```
|
|
|
|
Edit the new `child.yml` file according to your needs. See the [Helm chart configuration](https://github.com/netdata/helmchart#configuration) and the file itself for details.
|
|
|
|
You can then run `helm upgrade` with the `--set-file` argument to use your configured `child.yml` file instead of the
|
|
default, changing the path if you copied it elsewhere.
|
|
|
|
```bash
|
|
helm upgrade --set-file sd.child.configmap.from.value=./child.yml netdata netdata/netdata
|
|
```
|
|
|
|
Now that you pushed an edited ConfigMap to your cluster, service discovery should find and set up metrics collection
|
|
from your non-default service.
|
|
|
|
## Update/reinstall the Netdata Helm chart
|
|
|
|
If you update the Helm chart's configuration, run `helm upgrade` to redeploy your Netdata service, replacing `netdata`
|
|
with the name of the release, if you changed it upon installation:
|
|
|
|
```bash
|
|
helm upgrade netdata netdata/netdata
|
|
```
|
|
|
|
To update Netdata's Helm chart to the latest version, run `helm repo update`, then deploy `upgrade` it`:
|
|
|
|
```bash
|
|
helm repo update
|
|
helm upgrade netdata netdata/netdata
|
|
``` |